

Teams often treat observability as polish: ship the feature, then “add dashboards later.” Before traffic grows, that later becomes an outage postmortem with incomplete logs, missing owners, and no way to answer a simple question—what broke, for whom, and since when?
Observability is the ability to explain system behaviour from the outside using telemetry. For mid-market product and platform teams, it should be a first-class delivery gate—same as tests—whenever you expect load, multi-service integrations, or shared on-call to increase. This article lays out a practical sequence Calystron uses with engineering leads who need reliability without a full SRE organisation overnight.
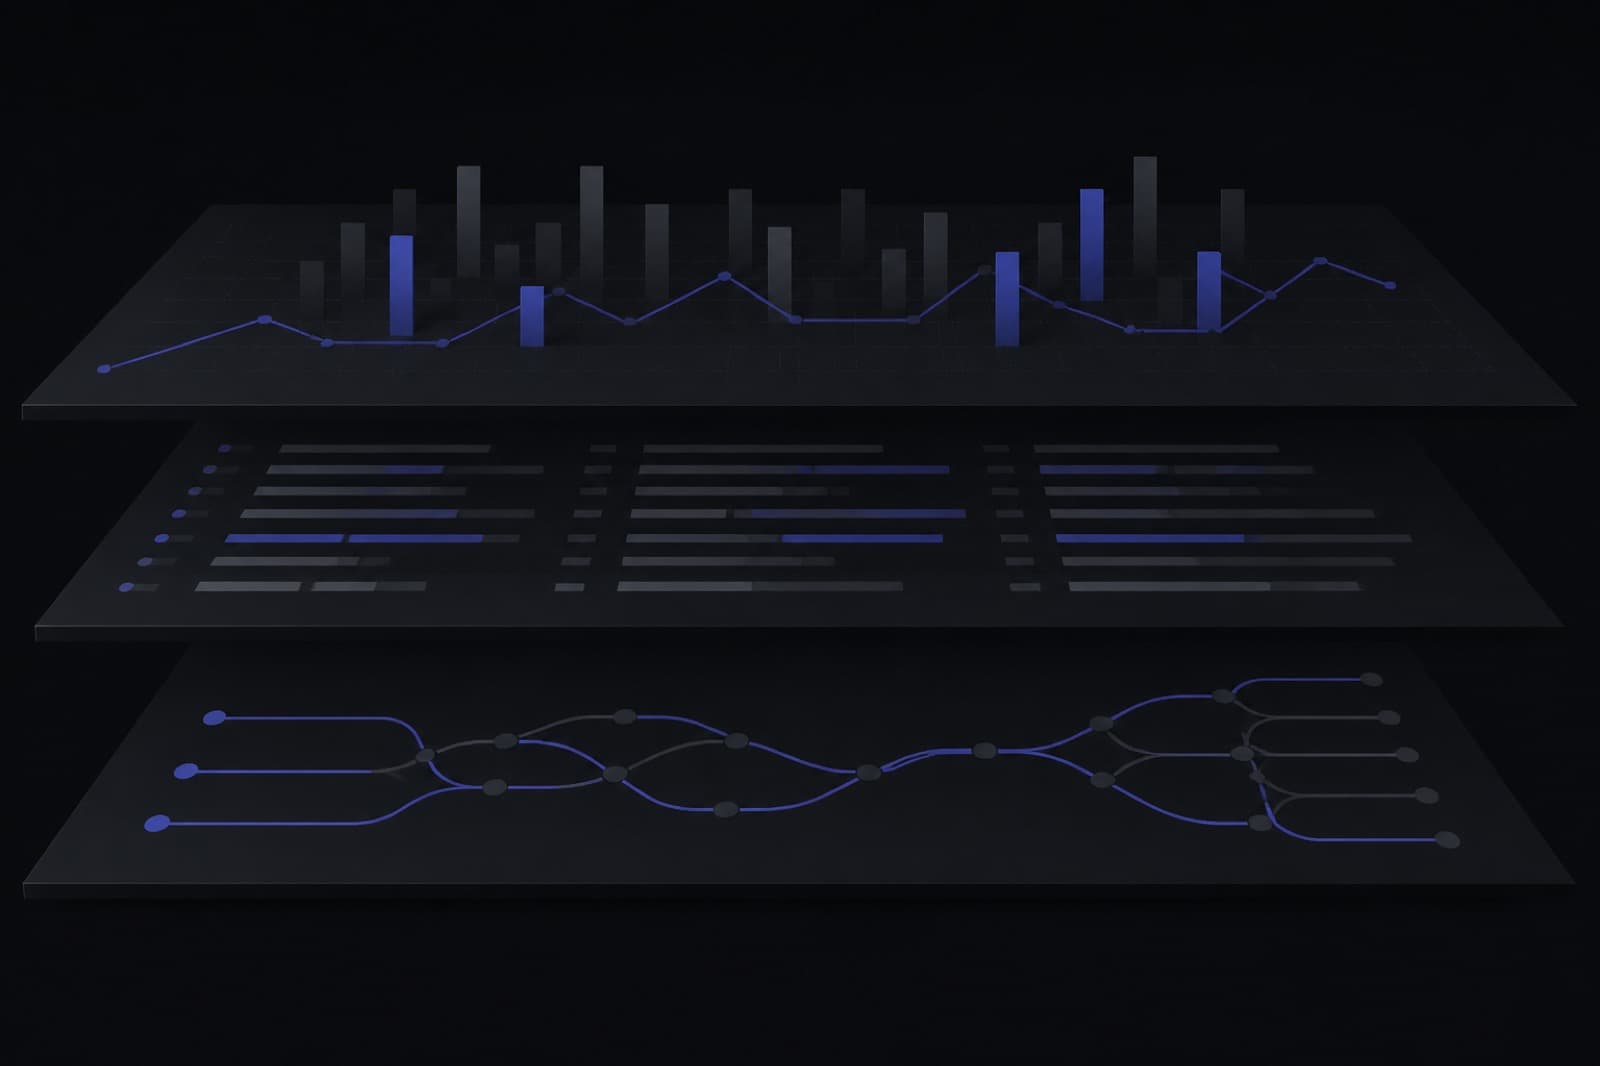
Why dashboards alone are not observability
A wall of graphs can look complete and still fail under incident pressure. Dashboards without correlation force engineers to guess which service owns the failure. Logs without structure make search slow. Traces without coverage on cross-team paths hide the hop that actually timed out.
Scale amplifies every gap. Doubling capacity without correlation IDs and ownership labels does not buy calm—it buys louder, harder-to-attribute failures. Treat telemetry design as architecture, not decoration.
A practical gate before you scale
Before a traffic milestone, marketing campaign, or major integration go-live, require the following on every critical path. “Critical” means revenue, safety, compliance, or customer trust—not every internal tool.
- Golden signals for each critical path: latency, errors, saturation, and traffic
- Structured logs with correlation IDs across services, queues, and webhooks
- Distributed tracing on paths that cross team or vendor boundaries
- Alert routes that page a named owner—not a shared inbox nobody owns
- Runbooks that map each high-severity alert to first checks and rollback options
Golden signals that survive on-call
Start with user-facing SLIs, not host CPU. Latency and error rate on checkout, login, or claim submission tell you whether customers are hurt. Saturation (queue depth, connection pools, thread pools) warns before errors spike. Traffic confirms whether a drop is “quiet night” or “upstream outage.”
Keep the first dashboard small. One row per critical journey beats twenty panels nobody trusts. Expand only when a panel has changed a decision in an incident or a capacity review.
Minimum labels that keep queries honest
Labels are how finance, security, and engineering share the same vocabulary. Without them, every query becomes a tribal-knowledge scavenger hunt.
YAMLlabels:
  service: checkout
  env: production
  owner: platform
  criticality: high
Logs, traces, and the “no SSH” test
Structured logs should answer request-level questions: which tenant, which correlation ID, which dependency failed. Free-text dumps are fine for local debugging; they are not an operations strategy.
Traces earn their keep on boundaries—API gateway to service, service to queue, queue to worker, worker to third-party API. If your slowest path crosses a vendor, instrument that hop before you negotiate an SLA credit.
Observability is not a vendor. It is the ability for the on-call engineer to explain a failure without tribal knowledge.
Alerting that people will actually answer
- Page on symptoms that map to user harm or imminent saturation—not on every warning.
- Attach a runbook URL and an owner team to every paging alert.
- Review noisy alerts weekly for the first month after a go-live; silence is not success if you are blind.
- Separate “investigate tomorrow” tickets from “wake someone now” pages.
How Calystron sequences the first sixty days
We map critical journeys with the product owner, define SLIs that leadership already cares about, instrument correlation across those paths, and only then tune dashboards. Tooling choice follows the operating model: who is on-call, where logs live, and what finance needs for cost attribution.
If you are evaluating a partner, ask how they would prove the “no SSH” test before traffic grows—not which logo appears on a slide.
Frequently asked questions
What is the difference between monitoring and observability?
Monitoring tells you when a known condition is breached (for example, error rate above a threshold). Observability is the ability to ask new questions about system behaviour using logs, metrics, and traces—especially during novel failures. You need both: monitors for paging, telemetry design for diagnosis.
When should a mid-market team invest in distributed tracing?
Prioritise tracing when requests cross more than one team-owned service or a third-party API on a critical path. A single monolith with clear logs may wait; a checkout that hops through gateway, cart, payments, and a webhook should not.
How do we avoid alert fatigue before a scale event?
Page only on user-harm or imminent saturation, require an owner and runbook on every paging alert, and schedule a noisy-alert review in the first weeks after go-live. Ticket the rest. Fatigue is usually a design problem, not a staffing problem.
Can we add observability after we scale?
You can, but you will learn during incidents instead of before them. Retrofits under load compete with firefighting. Treat telemetry as a release criterion for any milestone that increases traffic, integrations, or on-call blast radius.
Make sight a release criterion
Observability is delivery, not theatre. Make “can we explain a failure without SSH?” a go-live checkbox alongside tests and security review. Traffic growth then becomes a capacity problem—not a visibility crisis.
If your team is preparing a campaign, migration, or multi-service launch and wants a sequenced observability gate, talk to Calystron about a senior-led review of your critical paths and on-call model.